Microsoft Power BI Blog
Follow
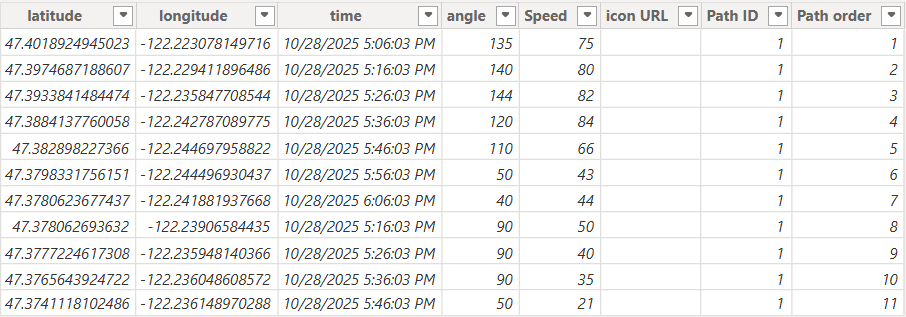
Introducing Markers in Azure Maps for Power BI
Azure Maps Visual in Power BI now features Markers, enabling data-driven location stories. Markers allow users to represent data points with custom icons or images instead of basic shapes. You can dynamically scale marker sizes to reflect various metrics like volume or sales. Customize colors and transparency to enhance visual clarity and integration within the map. Assign distinct icons per category for improved report interpretation and information visualization. Marker Layer can be integrated with Path and Reference Layers to create detailed map visuals. Logistics, utilities, and retail benefit from visualizing routes, statuses, and performance with custom icons. To implement, add the Azure Maps visual and input latitude, longitude, and other relevant data. Users can select icons, adjust sizes, and dynamically rotate them using the conditional formatting. The new marker feature improves data storytelling through richer and more meaningful map visuals within Power BI.