DEV Community
Follow
Adding and Customizing Sparklines in Excel Using Python
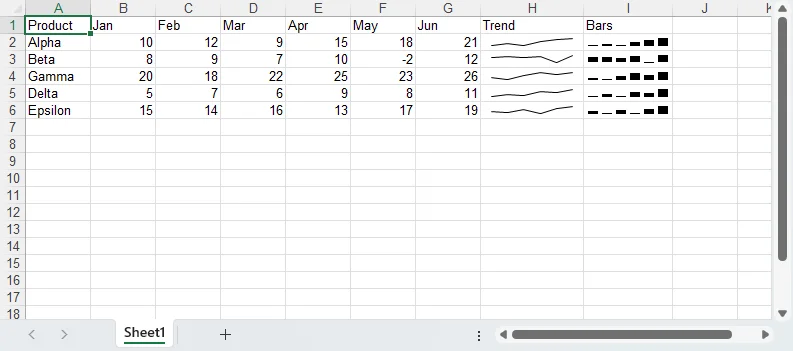
Sparklines are small charts within a single cell that visually represent data trends, showing rises, falls, and outliers at a glance. Excel 2010 and later versions support sparklines, which are managed as "sparkline groups" that share a common style. The Spire.XLS library for Python allows users to programmatically create and customize various sparkline types, including line, column, and win/loss variations. To use sparklines, the workbook version must be explicitly set to at least Excel 2013. Sparkline groups are created on a worksheet, and then individual sparklines are added to the group, binding a data range to a specific display cell. Line sparklines can have their color, weight, and markers customized, with options to highlight high and low points. Column sparklines offer features like coloring negative values separately, and marking first and last points. The handling of empty cells in sparklines can be configured to either show gaps or connect across missing data points. Win/loss sparklines are useful for comparing positive and negative values within a single bar, where negative values are drawn downwards and can be colored distinctively. When styling sparklines, it's efficient to style entire groups rather than individual sparklines. Key customization options include setting the sparkline color, line weight, showing markers, and highlighting specific data points. The library also allows control over how horizontal axes are displayed and how empty cells affect the visual representation. Finally, it is important to release resources by calling Dispose() on the workbook object after use.