Daniel Roy Greenfeld: Using pyinstrument to profile Air apps
Air, built on FastAPI, can leverage pyinstrument for performance profiling. To enable this, install both air[standard] and pyinstrument. The example code demonstrates how to integrate pyinstrument by conditionally activating it based on an environment variable named PROFILING. This is crucial for avoiding performance overhead in production environments. A middleware function, profile_request, intercepts HTTP requests. If a profile query parameter is present, pyinstrument starts profiling. After the request is processed by call_next, pyinstrument stops and returns an HTML output of the profiling results. This allows visual inspection of performance bottlenecks. The application includes an index page with links to simulate delays using asyncio.sleep. These links can be accessed with the profile=1 query parameter to trigger profiling. To run the application with profiling enabled without permanently setting the environment variable, prefix the development server command with PROFILING=1. For instance, PROFILING=1 fastapi dev main.py will activate profiling for that specific run. The profiling results can then be viewed by navigating to http://localhost:8000 in your browser.
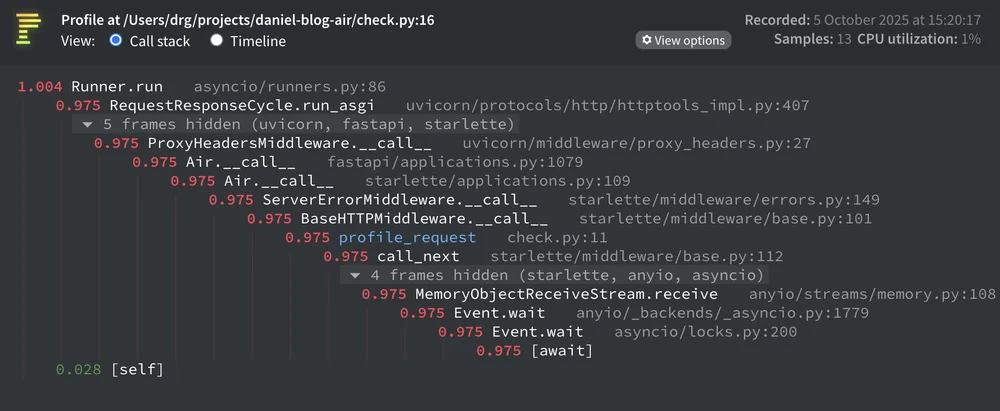
air[standard]andpyinstrument. The example code demonstrates how to integrate pyinstrument by conditionally activating it based on an environment variable namedPROFILING. This is crucial for avoiding performance overhead in production environments. A middleware function,profile_request, intercepts HTTP requests. If aprofilequery parameter is present, pyinstrument starts profiling. After the request is processed bycall_next, pyinstrument stops and returns an HTML output of the profiling results. This allows visual inspection of performance bottlenecks. The application includes anindexpage with links to simulate delays usingasyncio.sleep. These links can be accessed with theprofile=1query parameter to trigger profiling. To run the application with profiling enabled without permanently setting the environment variable, prefix the development server command withPROFILING=1. For instance,PROFILING=1 fastapi dev main.pywill activate profiling for that specific run. The profiling results can then be viewed by navigating tohttp://localhost:8000in your browser.