Google Cloud Blog
Follow
From query to action: Introducing SQL alerting in Cloud Monitoring Observability Analytics
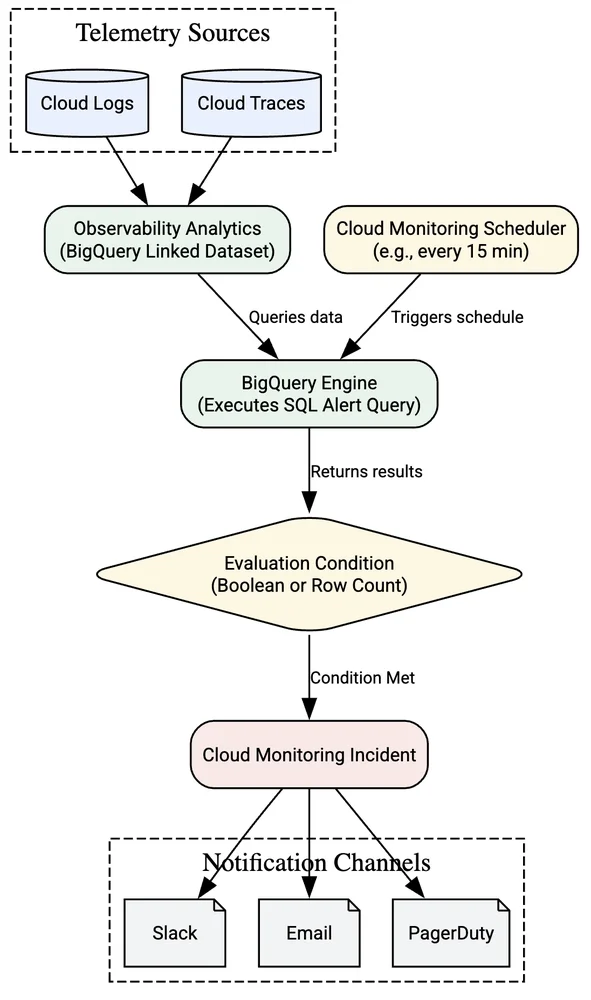
Traditional alerting systems struggle with high-cardinality data and complex relationships, often forcing a compromise between immediate, noisy alerts and rigid metric monitoring. Critical system issues are frequently hidden within aggregated data and signal correlations. Observability Analytics now allows users to query logs and traces using SQL, and importantly, to create alerts from these complex analytical queries. This SQL alerting capability in preview moves beyond basic threshold monitoring to deep, contextual detection.Alerting policies run scheduled SQL queries, analyzing recent data based on a lookback window. If query results meet a defined condition, a notification is sent through configured channels like email or Slack. The system leverages BigQuery for processing, incurring associated costs. Two alert trigger types are available: a row count threshold for simple event volume monitoring, and a boolean condition for more sophisticated logic directly within SQL queries.For example, an e-commerce operator can detect payment gateway outages by alerting on a spike in gateway timeout errors using a row count threshold. An AI platform engineer can monitor agent latency by querying trace data and alerting if the 99th percentile latency exceeds a specified limit using a boolean condition. Setting up SQL-based alerts requires enabling Observability Analytics for logs or traces, linking a BigQuery dataset, and configuring necessary IAM permissions and notification channels. Creating an alert involves composing and validating an SQL query in Observability Analytics, selecting the BigQuery engine, defining the alert condition and schedule, and configuring notification channels. Alerts can also be managed via API and Terraform for Infrastructure as Code.