Google Cloud Blog
Follow
How to troubleshoot GKE workloads faster with VPC Flow Logs
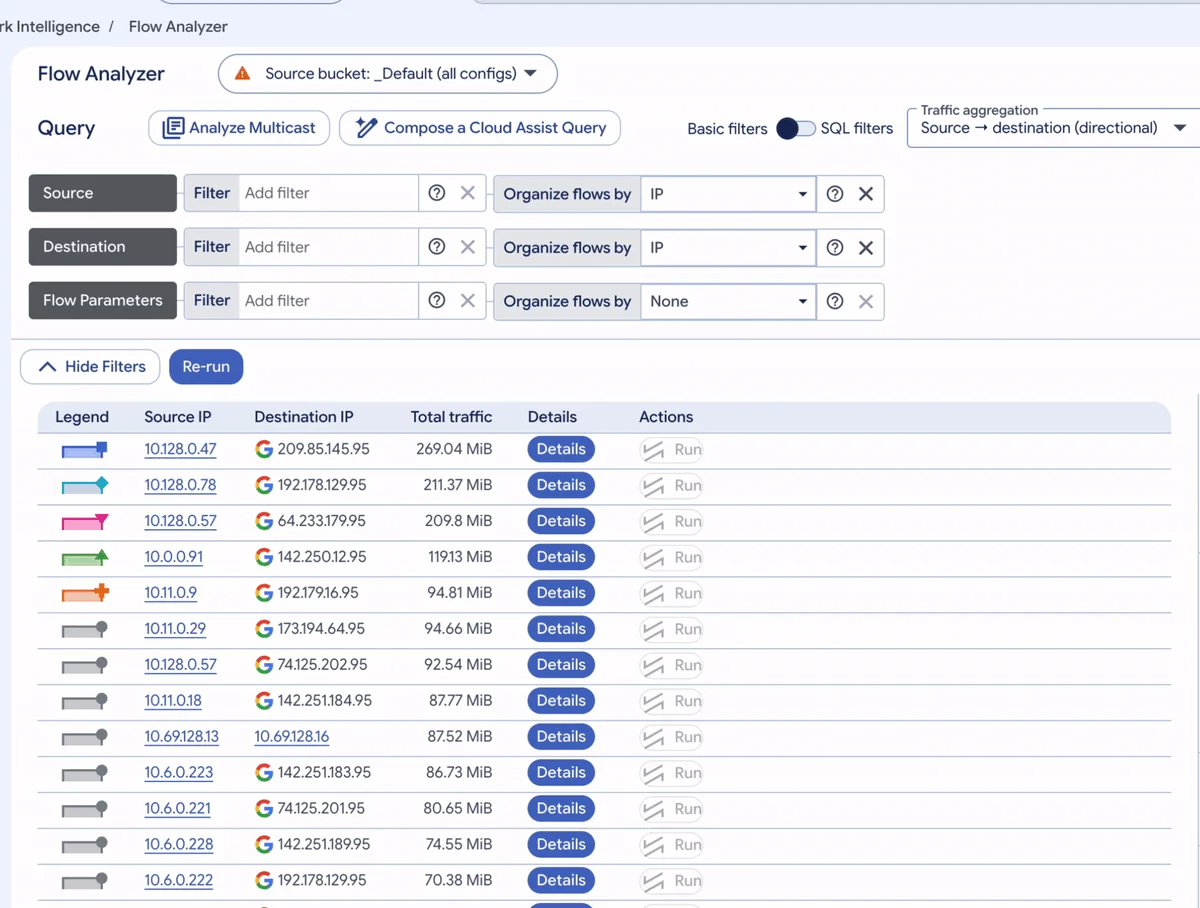
Understanding network traffic is crucial for managing Kubernetes environments efficiently. Standard cloud flow logs are insufficient for Kubernetes due to the ephemeral nature of pod IP addresses. Google Cloud's VPC Flow Logs solve this by enriching flow records with Google Kubernetes Engine (GKE) metadata like pod, workload, namespace, and service information. This enhancement provides workload-level attribution for network traffic without needing extra agents.To utilize this, users must upgrade their log bucket to Observability Analytics and enable VPC Flow Logs organization-wide, ensuring all metadata is included. For Standard GKE clusters, intranode visibility also needs to be enabled. These preparatory steps allow for seamless integration and detailed network insights.Once configured, traffic analysis can be performed visually using Flow Analyzer, which is part of Network Intelligence Center. Flow Analyzer transforms raw log entries into interactive charts and tables, allowing users to group and filter traffic by various Kubernetes attributes. This capability helps identify communication patterns and dependencies between microservices.For instance, users can map microservice dependencies by organizing flows by GKE workload, quickly identifying which endpoints are communicating. The tool can also drill down into a single service, revealing all its callers and their respective traffic shares, aiding in performance investigations.Furthermore, Flow Analyzer can detect cross-zone traffic by filtering flows where source and destination zones differ. This helps pinpoint specific pods driving inter-zone data transfer costs. However, it's important to note that VPC Flow Logs do not annotate pod-to-internet traffic, and blocked traffic by network policies is not recorded. Additionally, flow logs are sampled, making them better suited for ranking and trending rather than precise per-connection accounting.