Ontology-Driven Observability: Building an End-to-End Knowledge Graph at Netflix Scale
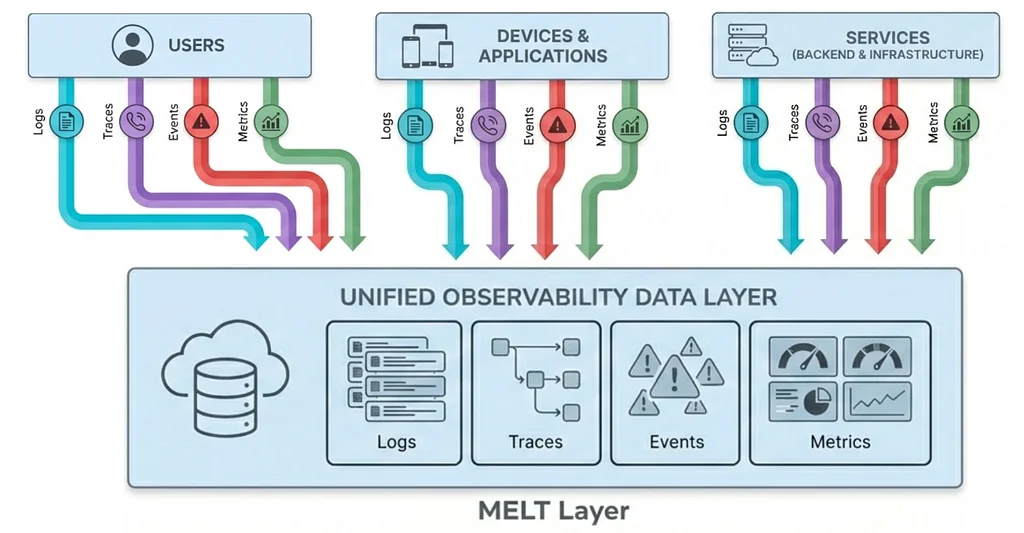
The company faces challenges in understanding its massive, complex infrastructure, especially during live events like the Jake Paul and Mike Tyson fight which drew 65 million streams. Debugging issues, such as a slow-rendering home screen, can take hours because information is siloed across different systems. These systems collect data through metrics, events, logs, and traces (MELT), but correlating this data effectively is difficult. The core problem is the lack of a shared, machine-readable understanding of operational entities.To address this, they developed an "Observability Ontology," a formal specification of types, properties, and relationships within their operational world. This ontology uses standards like RDF, OWL, SHACL, and SPARQL, storing data as a knowledge graph. A key design decision was to avoid a generic "Service" type, instead using specific, validated types like ops:Application. They also chose to model the reasoning and context from incident discussions, transforming unstructured chat into structured triples.The ontology creates determinism from inherently stochastic processes like LLMs and fuzzy matching through a pipelined approach. This pipeline uses "enrichers" that reduce entropy by converting noisy input into typed triples, following strict contracts. These enrichers ensure every entity has a type, URIs follow a naming scheme, and applications are validated against a catalog. The pipeline runs sequentially to avoid race conditions, with external calls being best-effort to prevent blocking.A "Correlation Engine" then assimilates signals from various sources, identifying causal or correlatory chains of events. It analyzes thirteen signal types, proposing hypotheses with evidence and confidence scores, storing supporting graph records. Each cycle of observation, enrichment, correlation, and storage forms a "Knowledge Flywheel," continuously enriching the knowledge graph and improving system context. This flywheel aims to reduce debugging time by providing a unified and interconnected view of system operations.

ops:Application. They also chose to model the reasoning and context from incident discussions, transforming unstructured chat into structured triples.The ontology creates determinism from inherently stochastic processes like LLMs and fuzzy matching through a pipelined approach. This pipeline uses "enrichers" that reduce entropy by converting noisy input into typed triples, following strict contracts. These enrichers ensure every entity has a type, URIs follow a naming scheme, and applications are validated against a catalog. The pipeline runs sequentially to avoid race conditions, with external calls being best-effort to prevent blocking.A "Correlation Engine" then assimilates signals from various sources, identifying causal or correlatory chains of events. It analyzes thirteen signal types, proposing hypotheses with evidence and confidence scores, storing supporting graph records. Each cycle of observation, enrichment, correlation, and storage forms a "Knowledge Flywheel," continuously enriching the knowledge graph and improving system context. This flywheel aims to reduce debugging time by providing a unified and interconnected view of system operations.