Open Source Profiler on an Internet Scale Fleet: Pinterest and Intel Partnership on gProfiler
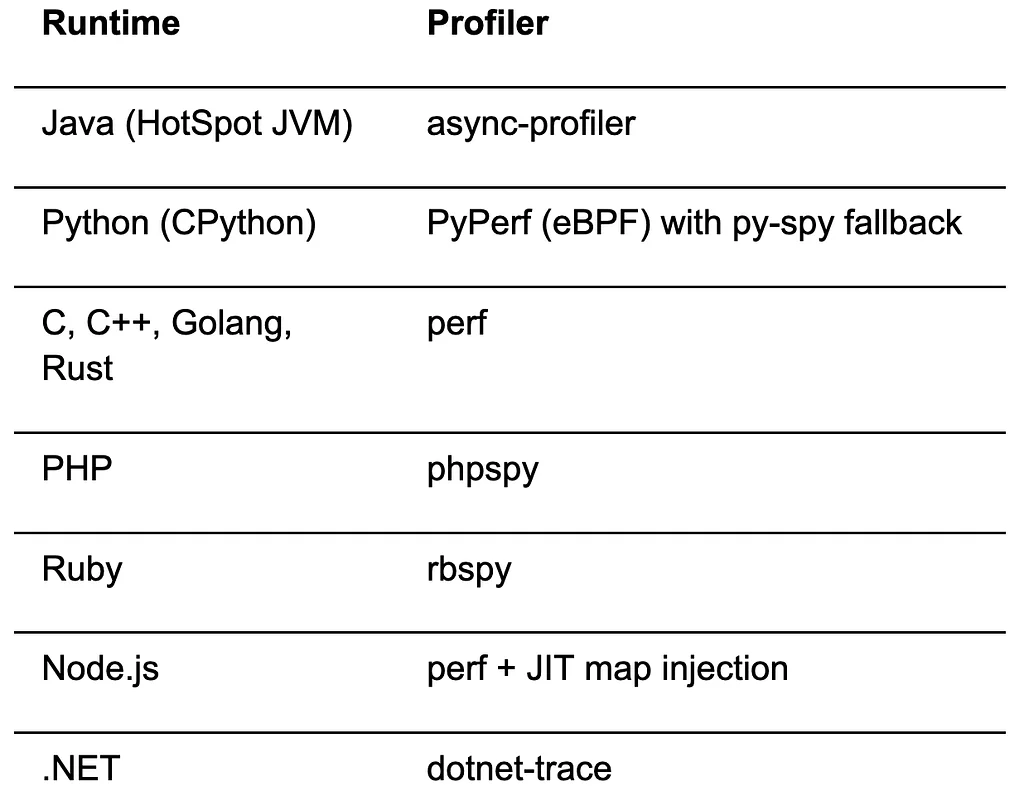
Pinterest, serving 640 million users, partnered with Intel to improve infrastructure efficiency through profiling. Initially, they faced challenges with fragmented profiling tools and the need for a unified, scalable solution. They chose to enhance the open-source gProfiler, originally developed by Granulate, a former Intel subsidiary. This collaboration aimed to create a robust profiling system for large-scale cloud environments.Pinterest and Intel extended gProfiler by adding dynamic profiling, allowing on-demand profiling sessions. They integrated Intel PerfSpect for hardware telemetry, capturing details like cache behavior and CPU stalls. Wall-time profiling was introduced to detect latency from I/O or lock contention, which CPU flame graphs miss. They also added PMC flame graphs to link functions to hardware events and contributed production-hardening fixes to ensure efficiency at scale.The partnership focused on an open-source approach to avoid vendor lock-in and foster collaboration. gProfiler orchestrates multiple language-specific profilers to produce unified flame graphs, offering a comprehensive view of system activity. Pinterest's decision to partner stemmed from the realization that building such a complex tool from scratch would be immense, and Intel’s hardware expertise was crucial for deep bottleneck analysis.The open-sourcing of gProfiler and its backend, gProfiler Performance Studio, provided Pinterest with a foundation to build upon. Pinterest then deployed gProfiler agents across its fleet, addressing reliability concerns related to resource consumption and data ingestion. Their significant contributions include the dynamic profiling feature, enabling fleet-wide on-demand profiling.These contributions also unlocked additional capabilities such as wall-clock time profiling and hardware event-based flame graphs. The gProfiler architecture consists of an agent for data collection on each node and a backend for aggregation and visualization. The agent coordinates various language profilers to generate merged stack traces, providing a unified view without application code modifications. The backend microservices handle profile ingestion, storage in S3, indexing into ClickHouse, and visualization via a React frontend.