The Quest to Understand Metric Movements
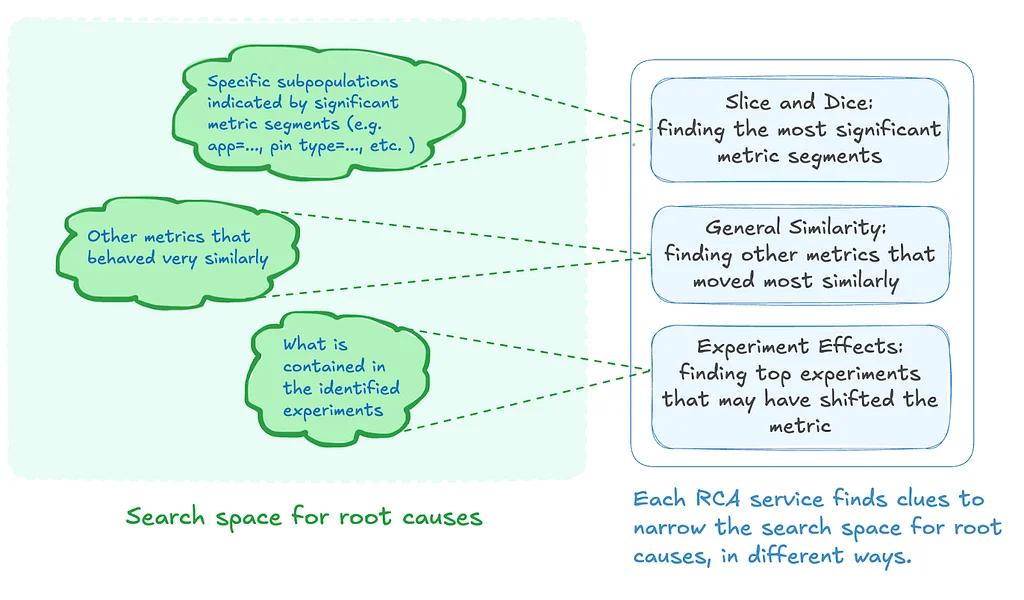
Pinterest developed a root-cause analysis (RCA) platform to understand metric fluctuations. The platform employs three key approaches: slice and dice, general similarity, and experiment effects. Slice and dice analyzes metric segments across various dimensions to pinpoint significant contributors to changes. This method draws inspiration from LinkedIn's ThirdEye, using a tree structure to organize metric segments and scoring their significance. General similarity identifies metrics with similar movement patterns, using correlation and dynamic time warping to measure similarity. This helps uncover relationships between seemingly unrelated metrics, like performance and content distribution. Experiment effects examine A/B testing results to determine if experiments influenced the metric. Welch's t-test and harmonic mean p-values are used to assess experimental impact, filtering for noise and imbalances. These three approaches can be used iteratively for a comprehensive analysis. Future improvements include a user feedback mechanism and leveraging causal discovery for stronger causal inference. Integration with more data platforms and user interfaces is also planned. The platform's success relies on user feedback and continuous improvement. The team acknowledges the contributions of Pinterest engineers and data scientists in the platform's development.